
Charts
See your values live with YTCC Charts and draw conclusions from them.
Real-Time Monitoring
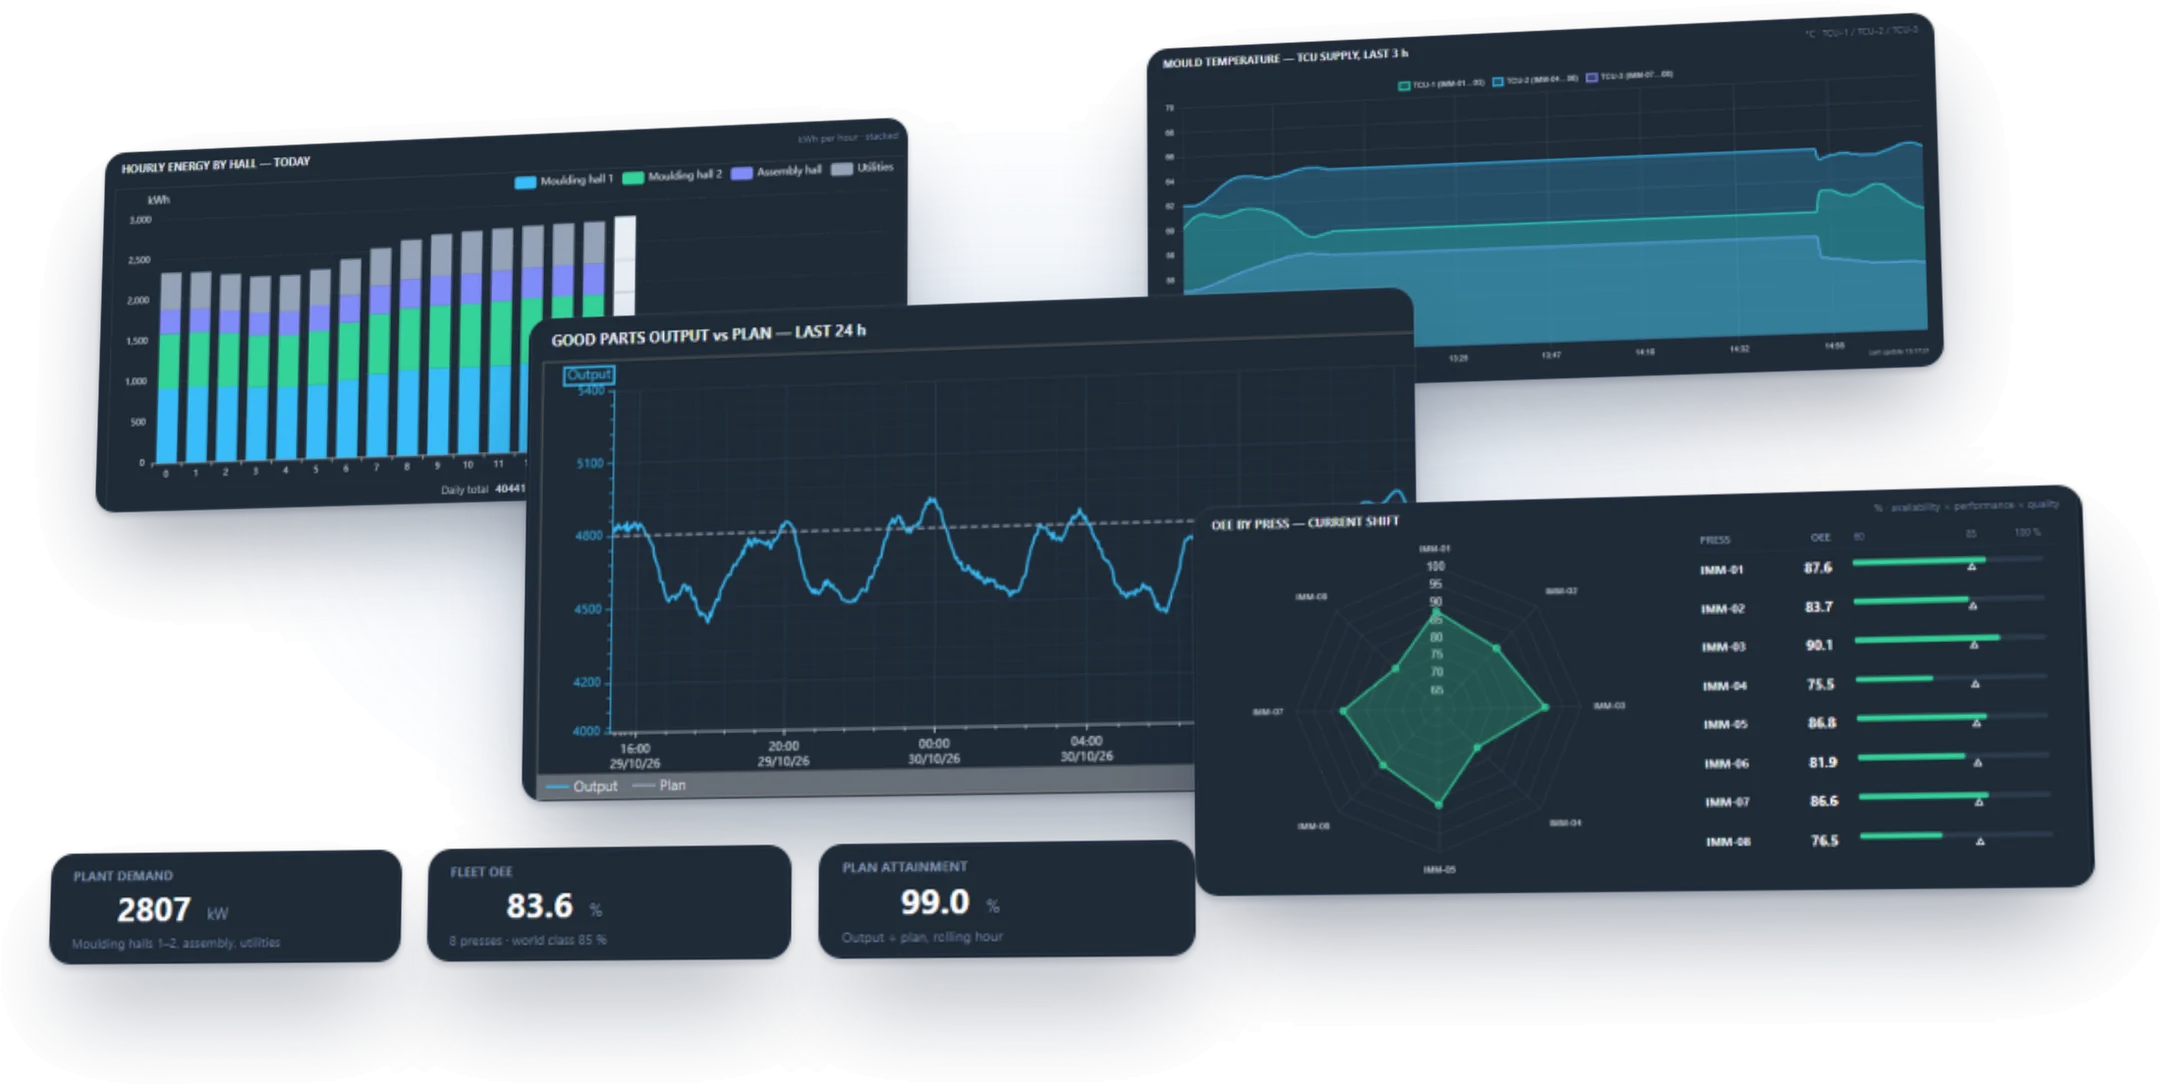
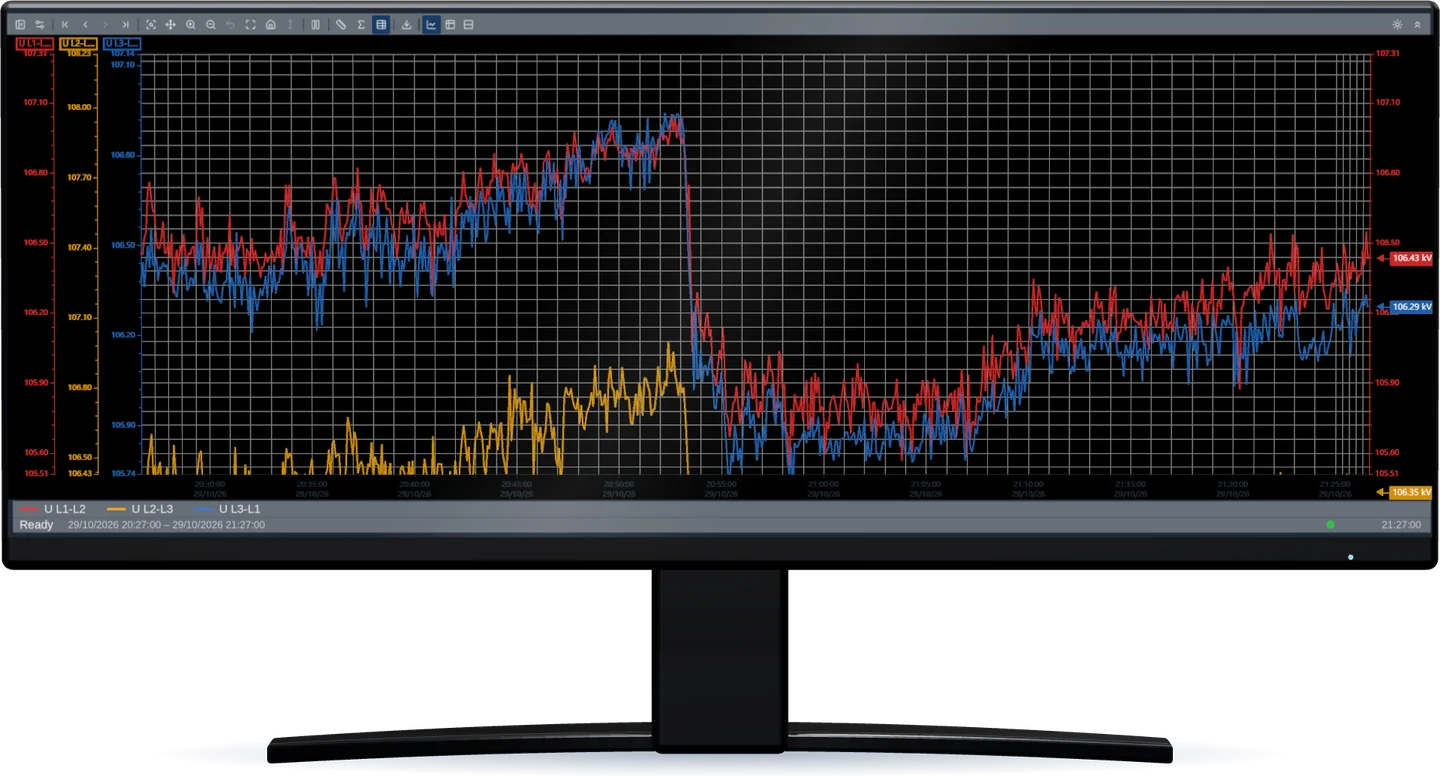
YTCC Charts display your data in real time. The advanced chart interface lets you view your data in whatever format you need.

Place charts on your screens
Drag the chart object onto a page in the screen editor and bind it to your signals. Your operators follow history and live values right next to the mimic.
Frequently asked questions
Can one chart show several signals?
Yes. Bind several signals to a chart and give each series its own label and color. The half gauge draws only the first series.
Which chart types can I use?
Line, area, bar, half gauge, pie and radar. The first three plot history over time; the other three show live values.
Do I have to archive a signal to see its history?
For line, area and bar charts, yes. These types read from the archive and plot averages over time intervals, and you set how often they refresh. Half gauge, pie and radar use live values and need no archive.
YTCC. Your trusted control center for energy and industrial SCADA.
Download YTCC and build your first screen.