
YTCC Demo Project – Water Pumping Station
- Industry
- Water and Wastewater
The YTCC demo project is a drinking water pumping station. Three pumps send water from a reservoir to the north, central and industrial supply zones. The project comes with the YTCC installers. Once you install YTCC, you can open it and look through its ten screens.
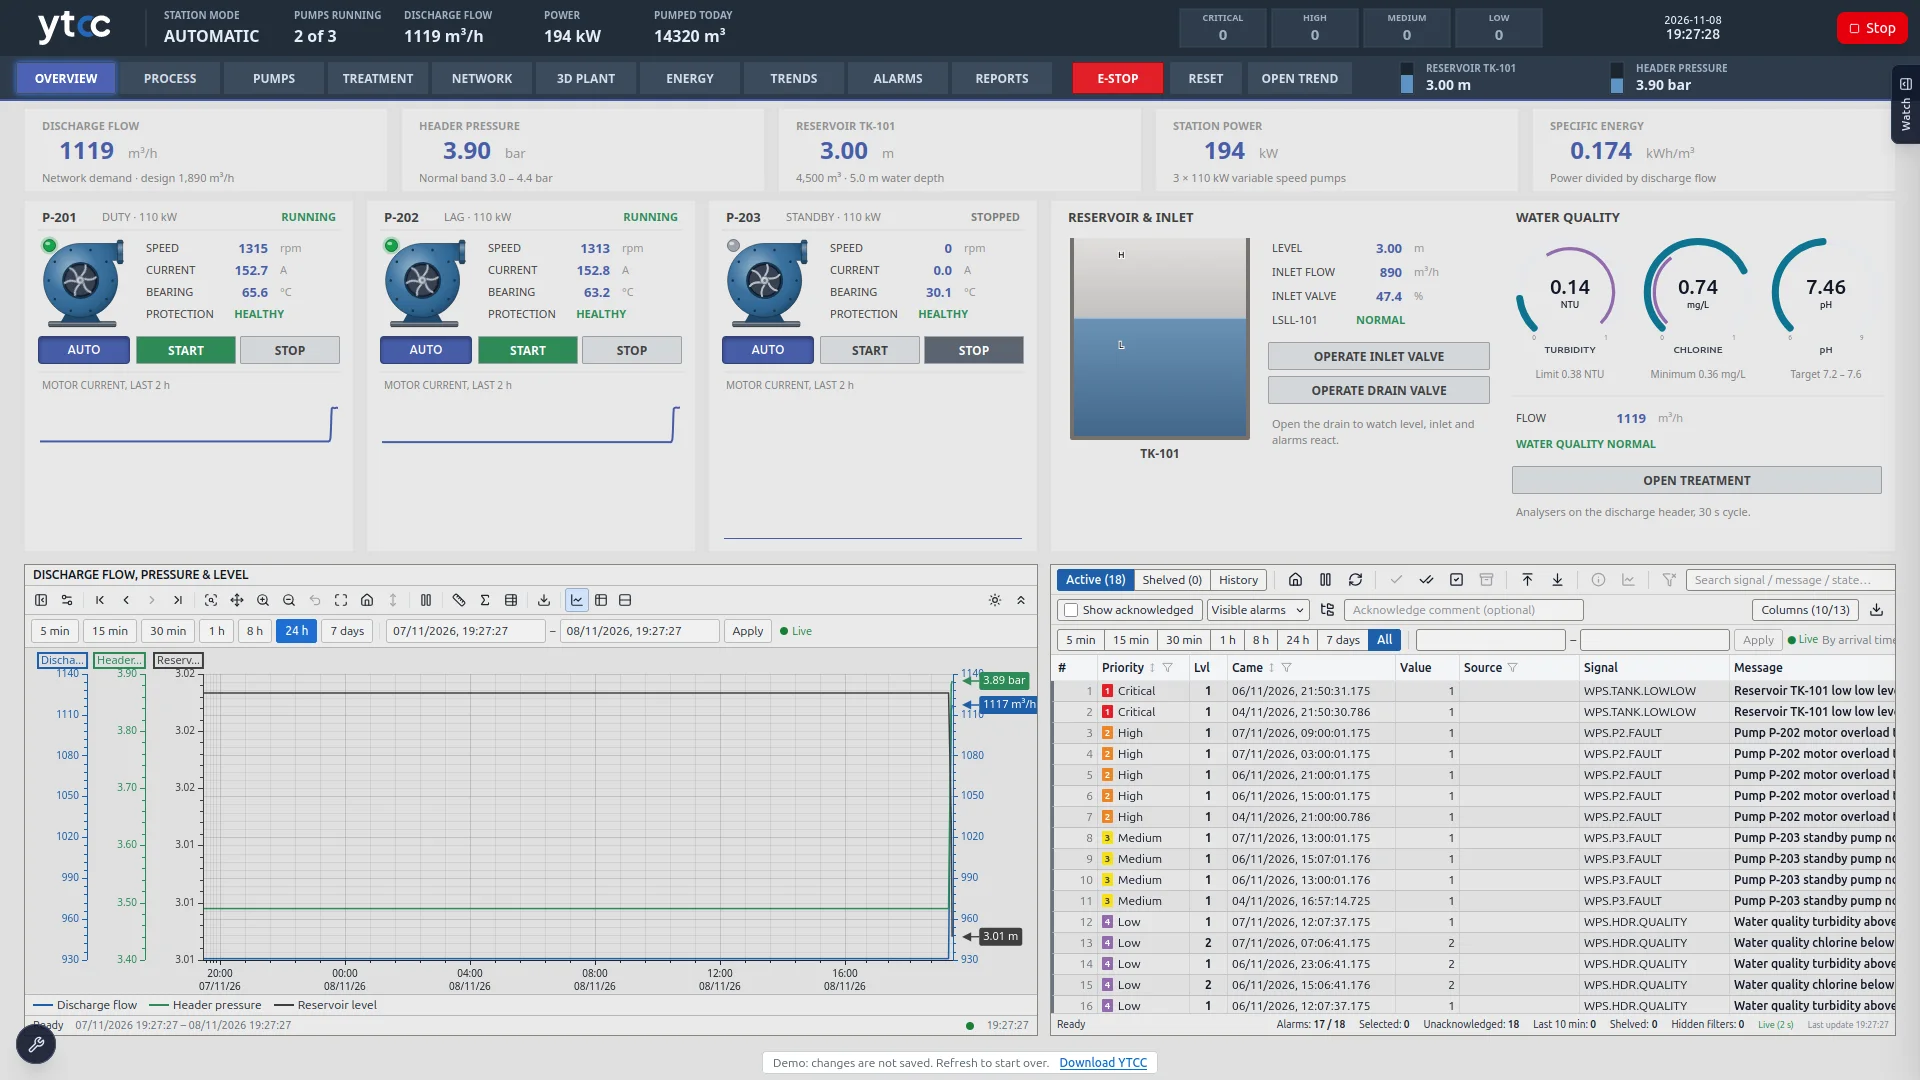
Discharge flow, header pressure, reservoir level and station power run across the top of the overview screen. Below them are each pump’s speed, current and bearing temperature, the water quality gauges, a trend and the active alarms. One pump runs as duty and one as lag; the third stands by.
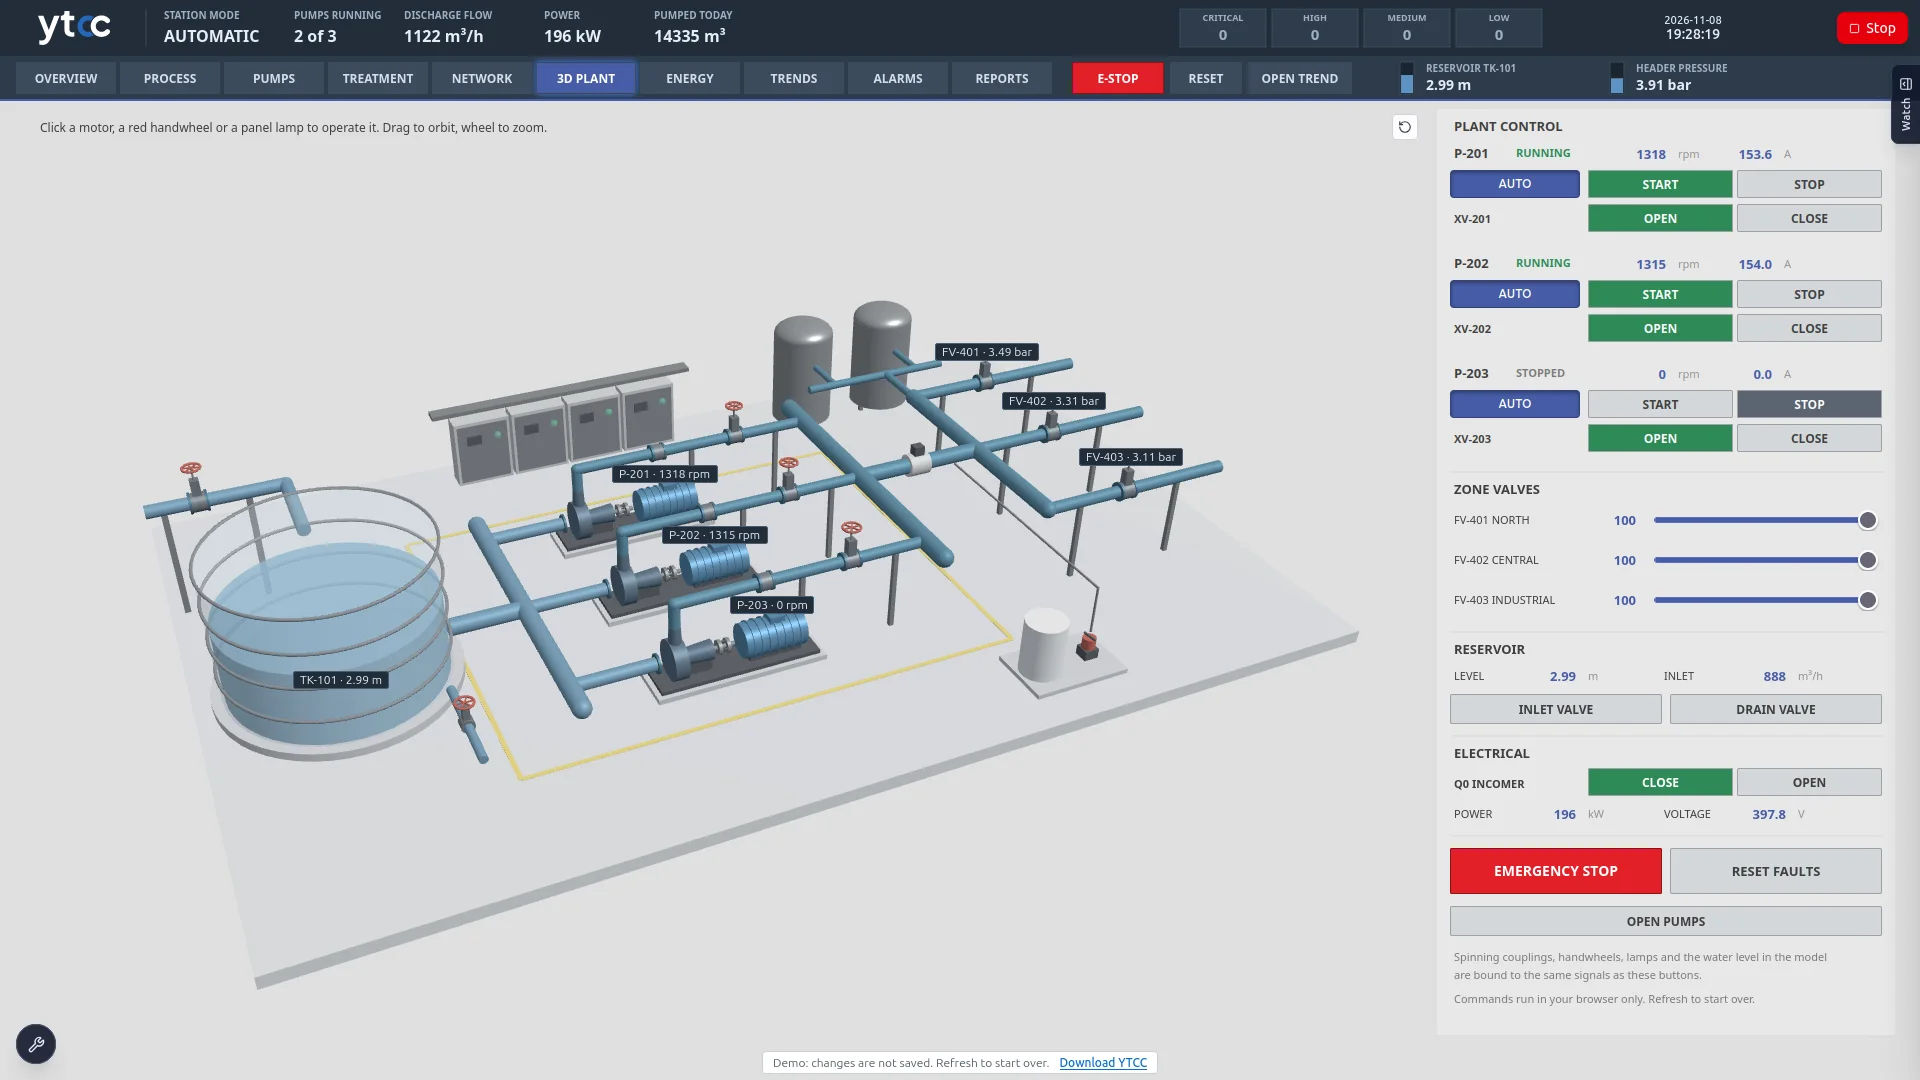
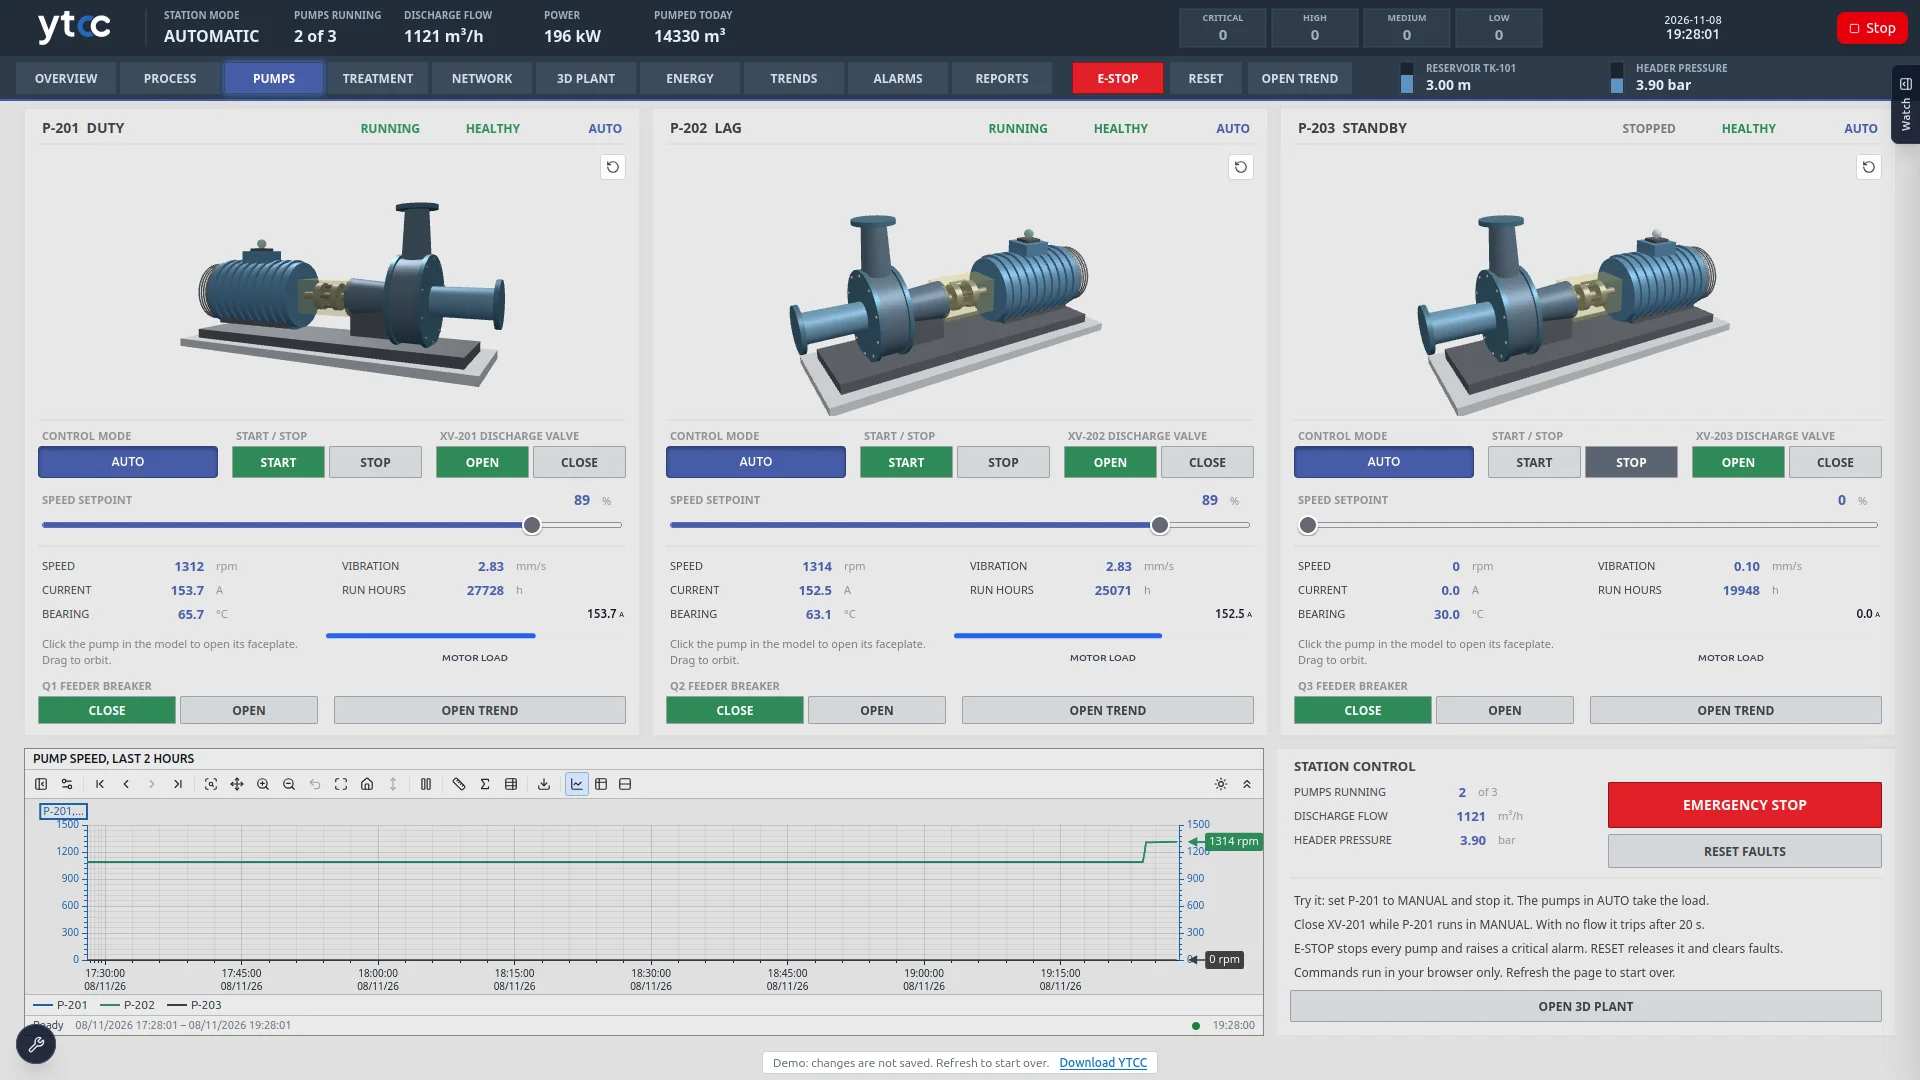
On the pumps screen, each pump has its own 3D model, control mode, start and stop buttons, discharge valve and speed set point. Switch the duty pump to manual and stop it, and the pumps in auto take over its load. The 3D plant screen shows the whole station in one model. Drag the model to rotate it, and click a motor, a red handwheel or a panel lamp to operate that equipment.
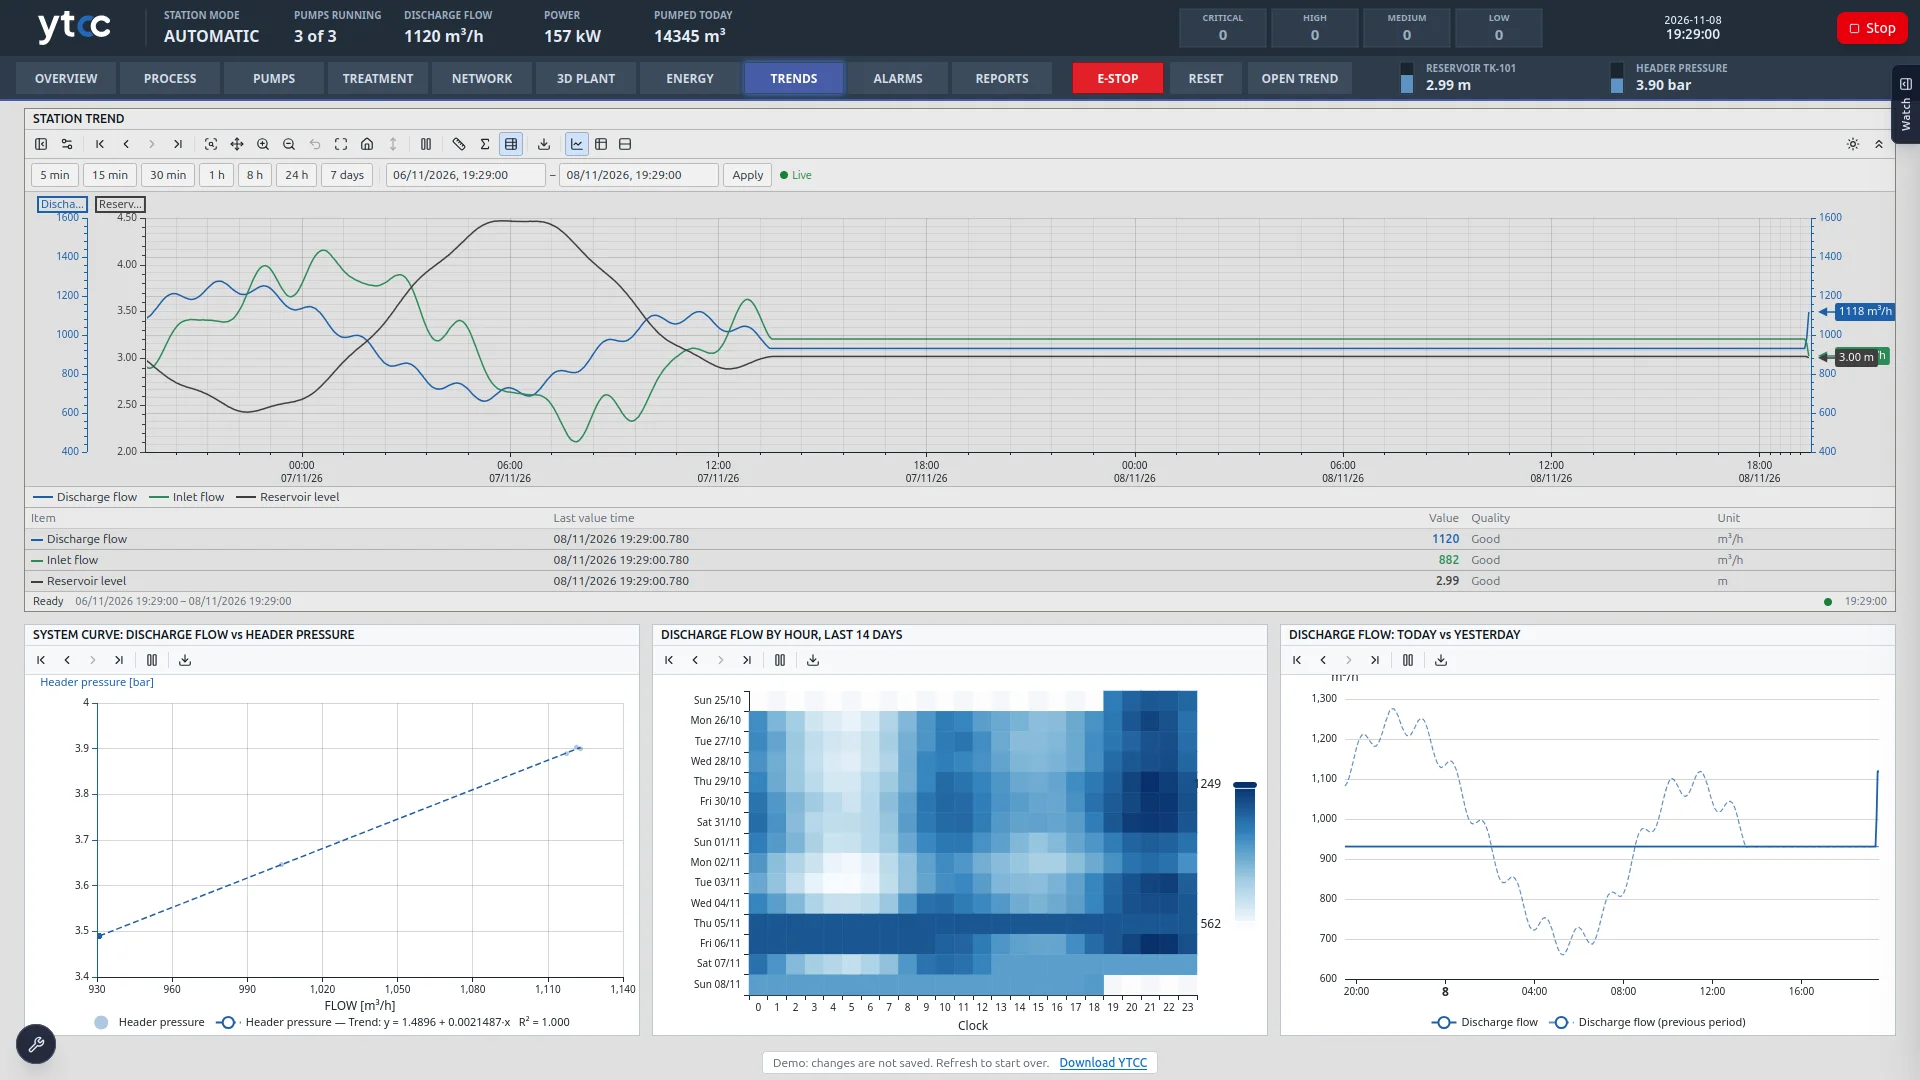
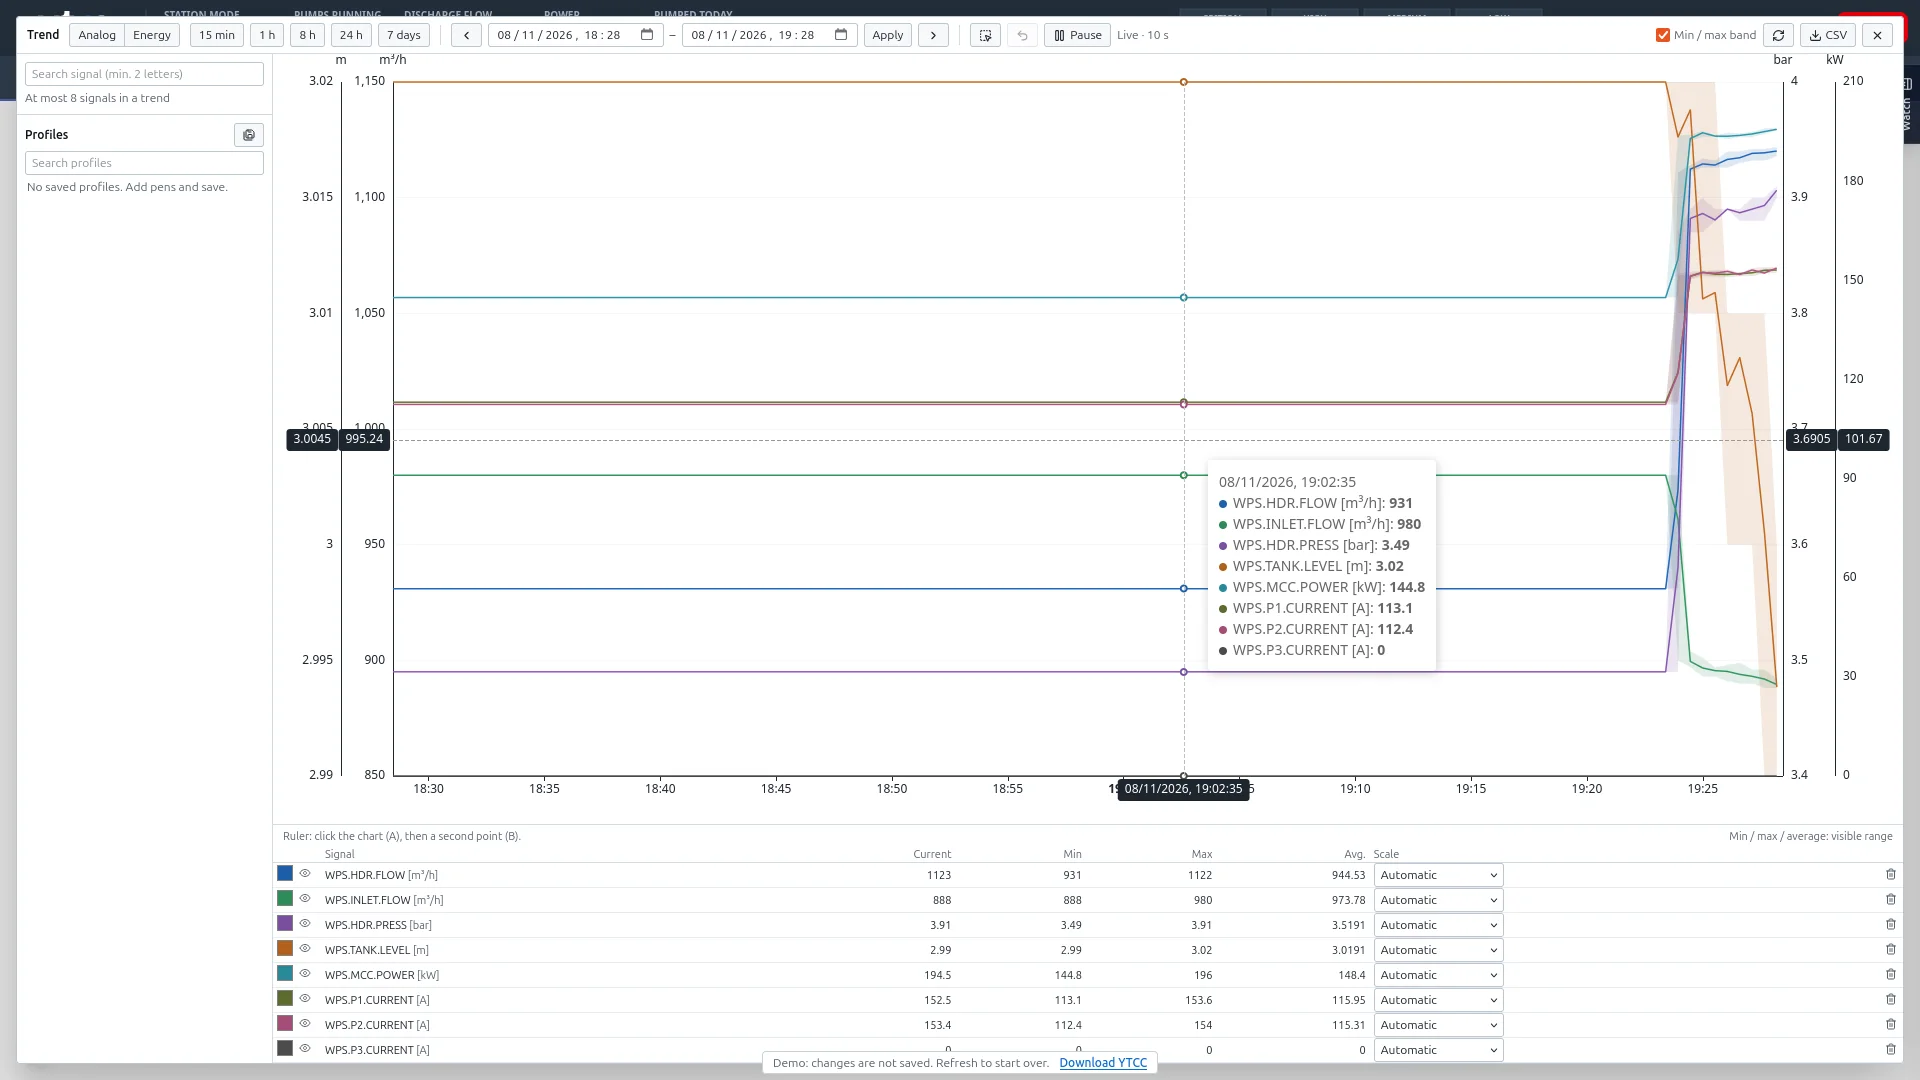
The trends screen shows flow and reservoir level over two days in one chart. The same screen has an hourly heat map of the last 14 days of flow and compares today’s flow with yesterday’s. Each alarm has one of four priorities: critical, high, medium or low. A strip at the top of each screen counts the alarms in each priority, and the alarm list keeps active, shelved and past alarms on separate tabs.
Technical details
- 3D model
- Station and pump models with clickable parts
- Symbols
- Pump and tank symbols, water quality gauges
- Control
- Auto and manual mode, start and stop, valves, emergency stop
- Charts
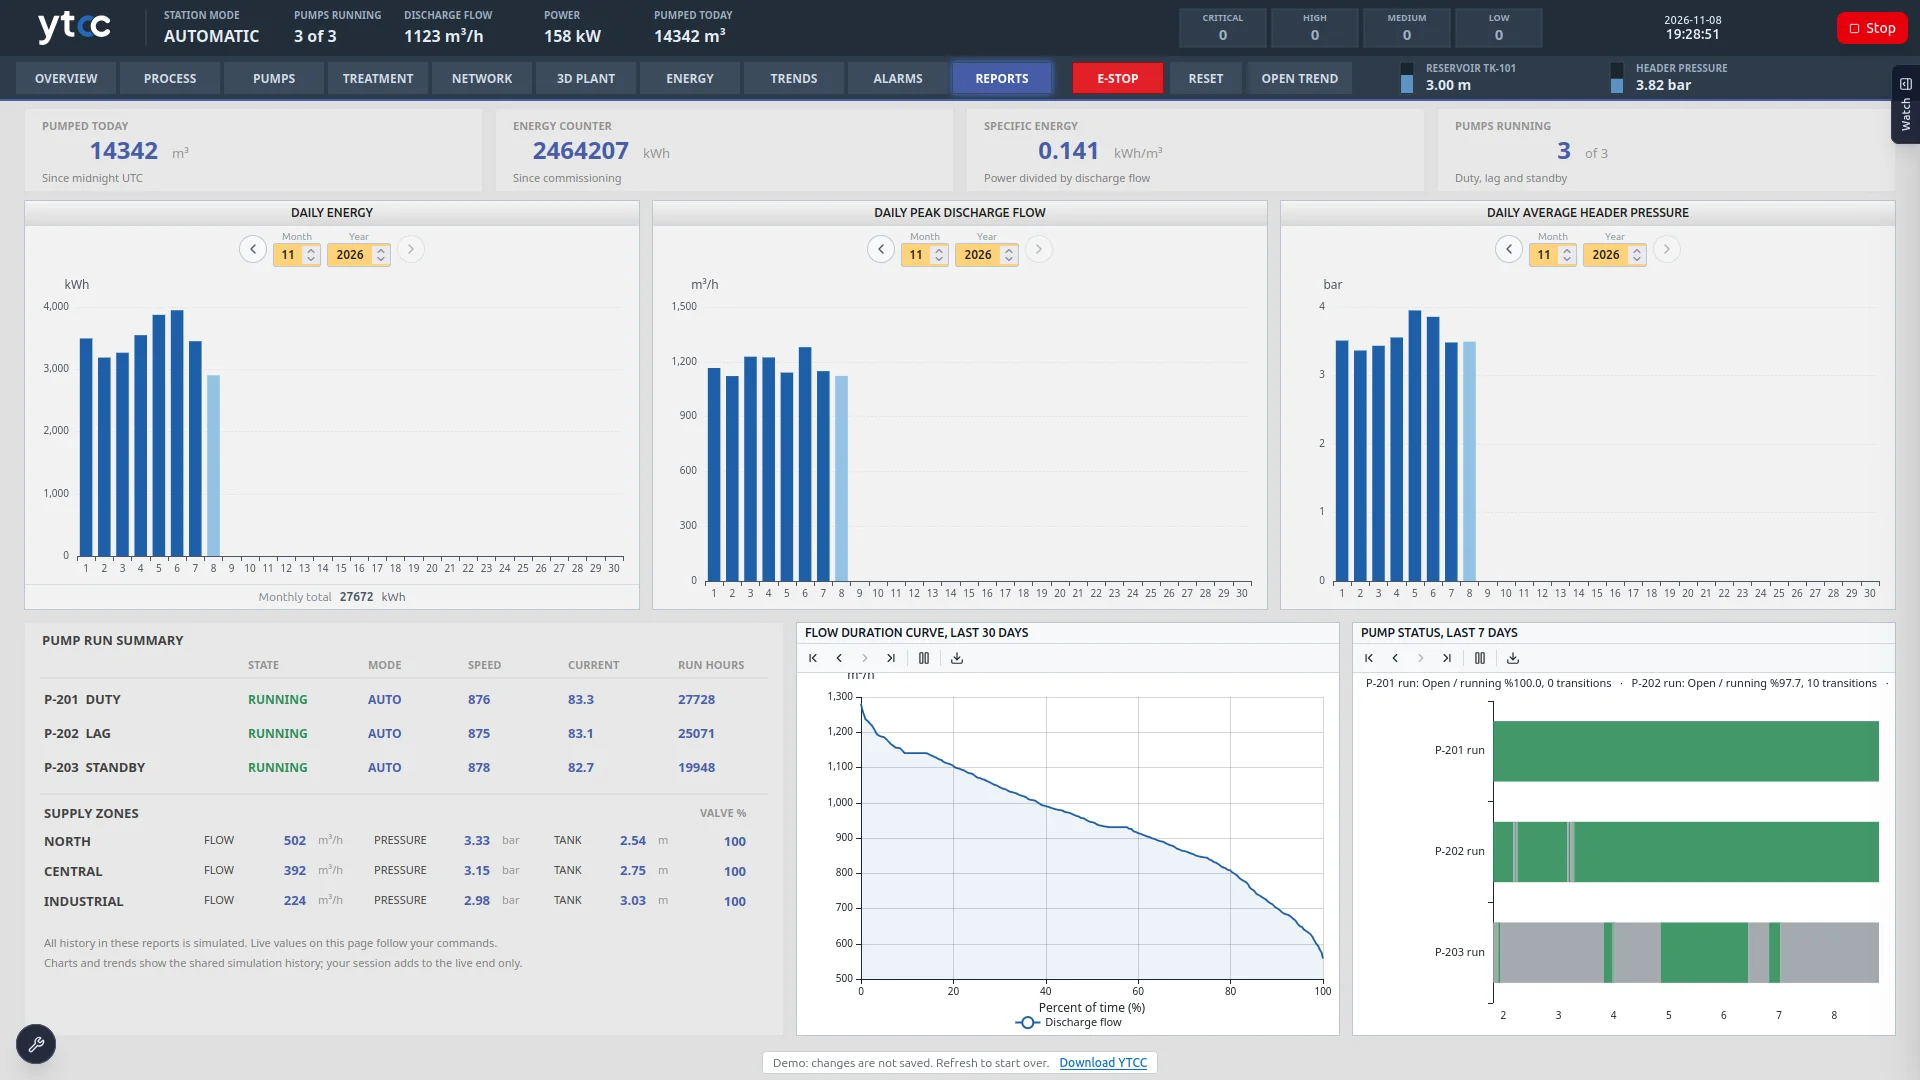
- Flow, pressure, pump speed and daily energy
- Trends
- Multi-signal trend window, hourly heat map
- Alarms
- Four priorities; active, shelved and history lists
Screens from the project
The readings and history on these screens are sample data generated for the demo.