Architecture 8 min read
Browser-based SCADA architecture: from the field to the screen
What runs on the server of a browser-based SCADA system, how a value reaches the screen and how a command reaches the field: processes, WebSocket, SVG screens and security.
Published:
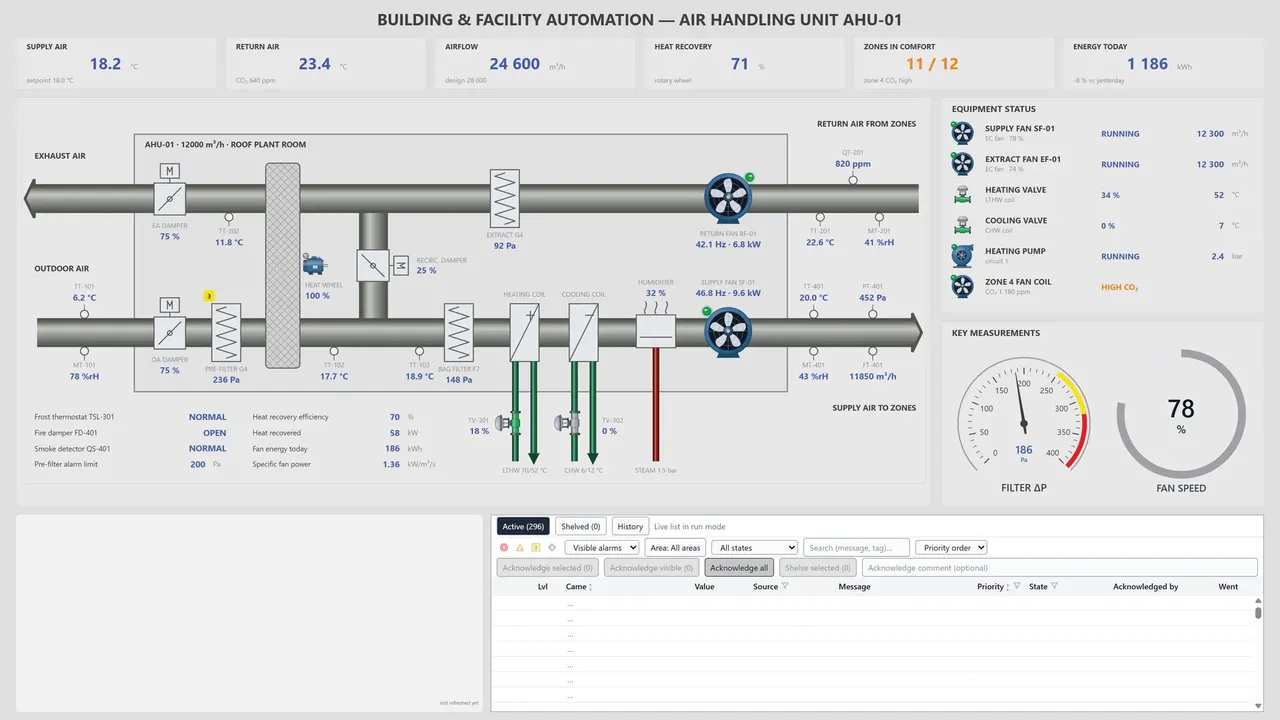
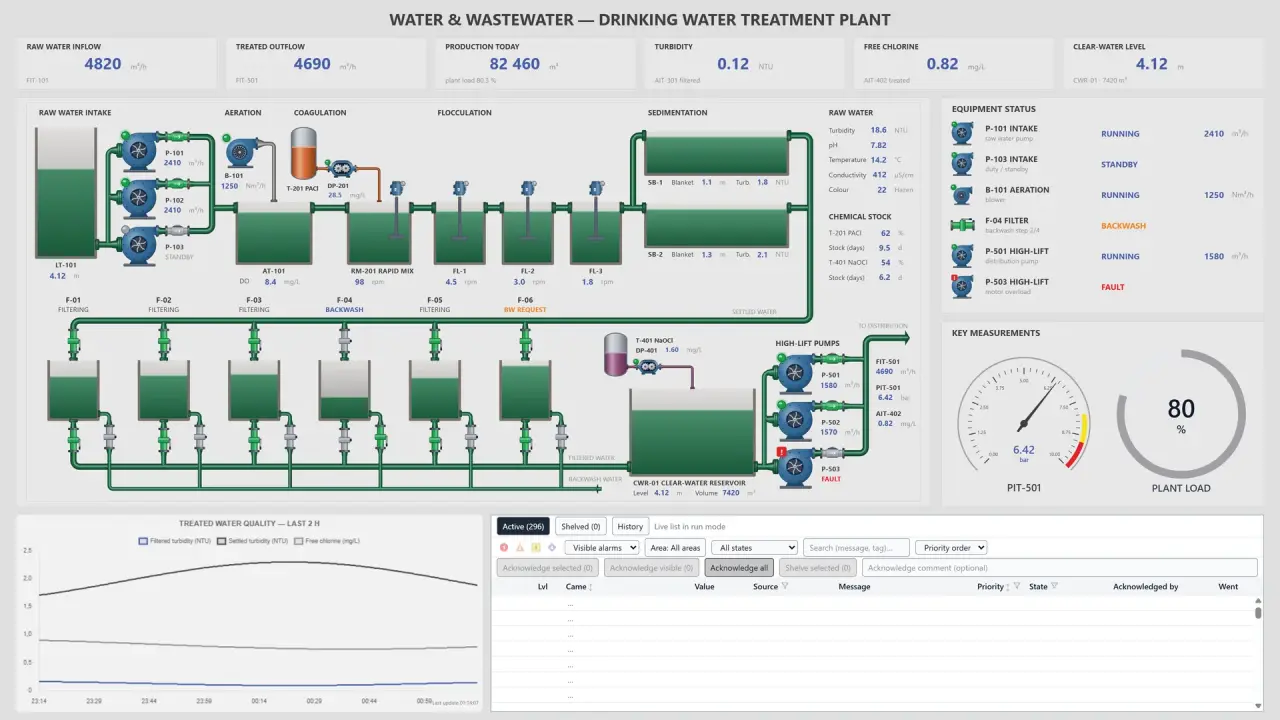
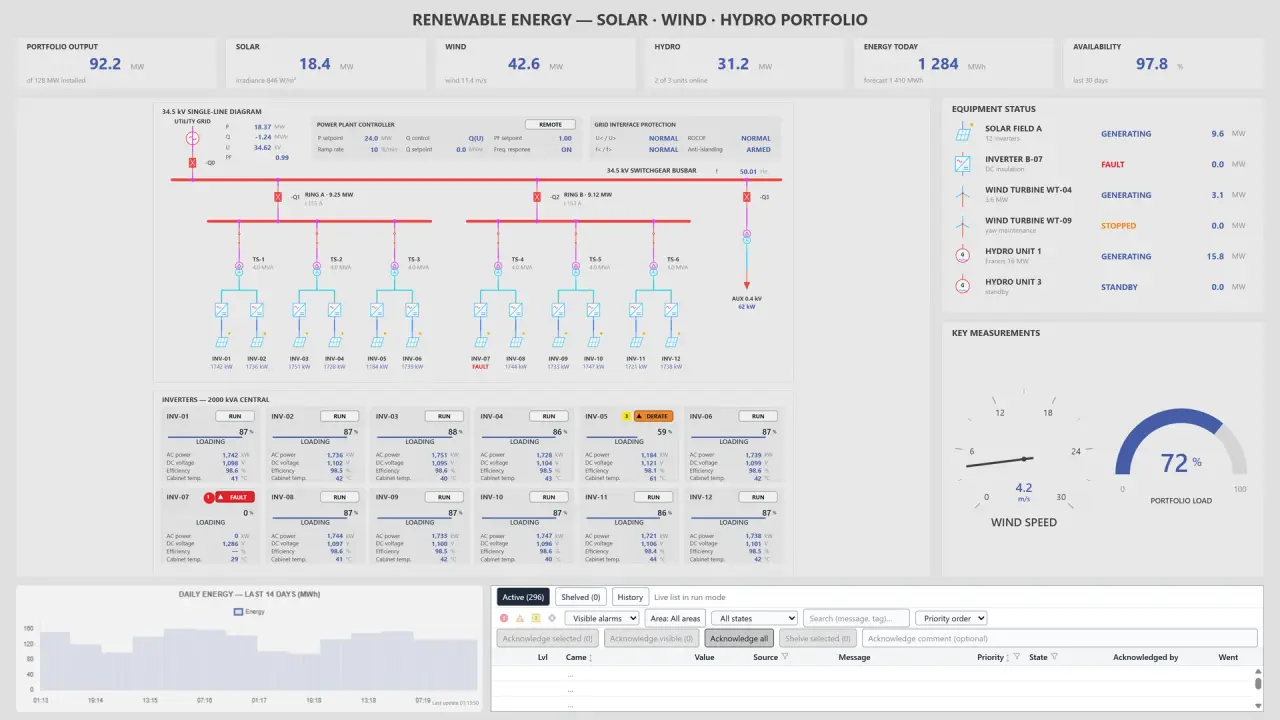
A browser-based SCADA system has three layers: the PLCs, RTUs and IEDs in the field; the SCADA server, which talks to those devices, evaluates alarms and writes the historian; and the web browser that operators and engineers use. Data collection, alarms and the historian run on the server. The browser draws the screens, shows the values the server sends and passes the user’s commands back to the server.
We covered how web-based SCADA differs from systems with installed clients in What is web-based SCADA?. This article looks inside the architecture: which parts run on the server, how a value travels from the field to the screen, and how a command travels from the screen to the field.
The layers
| Layer | What it contains | What it does |
|---|---|---|
| Field | PLCs, RTUs, IEDs, power meters, OPC UA servers | Controls and measures the process, time-stamps events |
| Server | Drivers, alarm engine, historian, scripts, web gateway | Collects, evaluates and stores data and serves it to clients |
| Client | Web browser (computer, tablet, phone) | Draws screens, shows values, passes on commands |
Closed-loop control stays in the field devices. If the link to the server or the browser drops, the PLC keeps running its program; the operator just cannot see the process for that time.
The server: separate jobs, separate processes
A SCADA server does several different jobs and usually splits them into separate software components:
- Communication drivers talk to devices in their own protocols, such as Modbus TCP, Siemens S7, OPC UA, IEC 60870-5-104 and DNP3. They hand every value to the server with a quality flag and a time stamp.
- The alarm engine compares values with limits, raises and clears alarms and keeps acknowledgments and history.
- The historian writes measurements, alarms, commands and events to a database in time order.
- The script runner runs the server scripts the engineer writes, when a value changes or at set times.
- The web gateway is where browsers connect. It authenticates users, pushes data to screens and receives commands.
When these components run as separate operating system processes, a supervisor process can start and watch each one and restart one that stops. The components talk to each other over an internal channel, and that channel does not need to be open to the plant network or the outside.
Data flow: from the field to the screen
Here is how a pump’s speed reaches the operator’s screen:
- The driver reads the value from the device, or the device sends the changed value itself (as in IEC 104 and DNP3).
- The value enters the server with its quality and time stamp. The alarm engine checks the limits and the historian records the value.
- The web gateway passes the value to the screens that show that signal.
- The browser updates the object on screen: it writes the number, changes the color or moves the tank’s fill level.
In the last two steps, how the browser gets its values matters. If the browser asks the server “anything new?” every few seconds (HTTP polling), you get both delay and needless traffic. Many systems use WebSocket instead. A WebSocket is a two-way connection that stays open between browser and server (RFC 6455), so the server sends a changed value without the browser asking.
The subscription model also sets the traffic. When a screen opens, it subscribes to the signals it uses and first receives their current values as one snapshot. After that, only changed values arrive. Signals that are not on the screen are never sent to that browser; even in a plant with thousands of signals, a single pump screen receives only its own.
What happens when a link drops is part of the design, too. When communication with a device is lost, the driver lowers the quality of its signals and the screen shows it: the last value appears in a “no communication” color, or a marker replaces it. The operator does not mistake an old value for a current one.
How screens are drawn in the browser
SVG is one of the formats browser-based SCADA screens use most often. SVG is a vector drawing format: pipes, tanks, valves and text stay sharp at any screen size, and because every object on the screen is a separate element, its color, visibility and fill level can change one by one. The engineer binds an object to a signal, and when a value arrives the browser updates only that object.
Process screens do not reflow like web pages: the position of breakers on a single-line diagram or the flow of a pipeline should not change when the screen gets narrower. That is why some systems let you design separate layouts of the same screen for desktop, tablet and phone sizes.
The command path: from the screen to the field
When an operator stops a pump, the command goes from the browser to the web gateway first. Permission checks happen there, on the server: does the user’s role allow writing to this signal, and who holds control of this area? A button hidden in the browser is not a security measure, because everything in the browser is in the user’s hands. If the server accepts the command, it passes it to the driver, the driver sends it to the device with the steps the protocol requires (such as select-before-operate in IEC 104), and the result is logged: who sent which value to which signal, when, and with what result.
The state on screen should change with the feedback from the device, not when the command leaves. Until the PLC reports the pump as stopped, the screen keeps showing it running.
Changing a running system
Changing the configuration of a running system takes care. In a good design, a change is validated first, the engineer sees the difference from the current state, and it is all applied in one transaction. Adding a point or fixing an address should not require restarting the whole driver.
Security and network layout
In an on-premise installation, the SCADA server runs on a computer at your site, and operators connect to it over the local network. NIST SP 800-82 recommends separating control systems from the business network in layers and controlling the paths between them. In practice:
- The SCADA server and the field devices sit on network segments set aside for control systems.
- The server’s web interface is reachable only from networks with authorized clients and is not exposed to the internet.
- Role and permission checks run on the server, and logins, configuration changes and commands go to an audit log.
Frequently asked questions
Does browser-based SCADA need an internet connection?
Not when the server runs at your site. Browsers then connect to it over the local network.
What do you install on an operator computer?
Only a web browser. Upgrades are installed on the server.
Does the field stop if the link to the server drops?
No. Control keeps running in the PLCs and RTUs. When the link returns, the screen gets the current values again.
In YTCC
YTCC has a core written in Rust, is service-based and runs on a single server. Each communication driver instance, the alarm engine, the historian writer, the script runner and the web gateway is a separate operating system process. A supervisor process starts and watches them and restarts a driver that crashes. Internal communication between the components is closed to outside networks by default.
Runtime screens are fed by a WebSocket subscription: first a snapshot, then only changed values, and each screen subscribes only to its own signals. When communication is lost, the dynamic colors of objects switch to the “no communication” color you set for the project. You design screens in the SVG-based Web Editor, and you can design separate desktop, tablet and mobile versions of the same page. Screens open from computers, tablets and phones on the local network, with no client installation besides the browser.
Changes in the configuration editor are validated, shown as a diff and applied in one transaction. Server scripts are written in TypeScript and run in a sandbox. Role-based permissions are checked on the server, and logins, configuration changes and commands go to the audit log. The historian keeps a separate database for each project.
All parts of the architecture are on the Platform page. To try it on your own computer, download YTCC.